
 It’s no secret that data is the new oil. Owing to the rising importance and demand of data analytics by companies all over the world, recruiters are scrambling to fill open positions. Getting started with data analytics can feel extremely daunting, and the sheer choices of available tools don’t help. Do you go for open-source or paid ones? Some open-source ones do better work, but premium ones offer, well, premium quality. So, here is a list of Top 10 Data Analytics tools, based on their performance, learning and popularity. Finding Data Analytics interesting? Here are the Top 5 reasons to become a data scientist
1. R Programming
 R is the leading analytics tool in the industry and is widely used for statistics and data modeling. It can easily manipulate data and present it in different ways. It has exceeded SAS in many ways like capacity of data, performance and outcome. R compiles and runs on a wide variety of platforms viz -UNIX, Windows and macOS. It has 11,556 packages and allows you to browse the packages by category. R also provides tools to automatically install all packages as per user requirements, which can also be well assembled with Big data. Wondering what exactly is data science? Here’s all you need to know
2. Tableau Public:

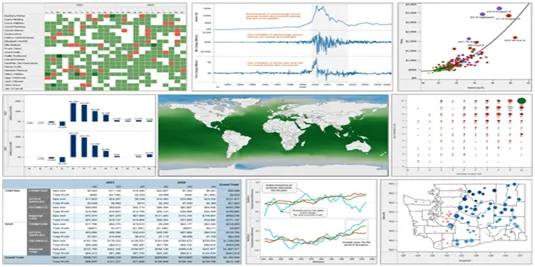 Tableau Public is a free tool that connects any data source you can think of. Be it corporate Data Warehouse, Microsoft Excel or web-based data. It additionally creates data visualizations, maps, dashboards etc. that too with real-time updates presented on the web. These can also be shared via social media or even with your client and allows you to download the files in different formats. But, it really shines when you have a very good data source. That’s when you see Tableau’s true power. Tableau’s Big Data capabilities make it supremely important. Its way of analyzing and visualizing data is far superior to any other data visualization software in the market. Fancy a career in Data Analytics? Check out Proschool’s PG Program in Data Analytics
3.Python

 Python is an object-oriented scripting language which is easy to read, write, and maintain. Plus, it is a free open source tool. It was developed by Guido van Rossum in the late 1980s and supports both functional and structured programming methods. Python is easy to learn as it is very similar to JavaScript, Ruby, and PHP. Also, Python has very good machine learning libraries viz. Scikitlearn, Theano, Tensorflow and Keras. Another important feature of Python is that it can be assembled on any platform like an SQL server, a MongoDB database or JSON. It can also handle text data extremely well.
4. SAS:

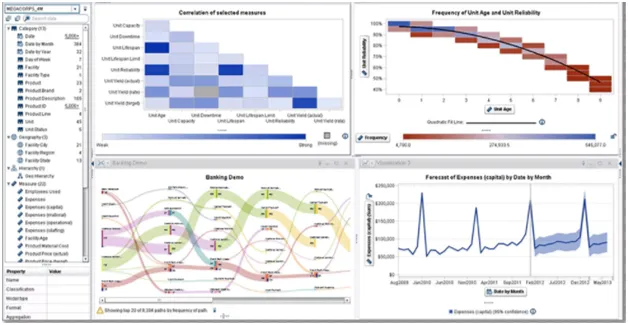 SAS is a programming environment and language for data manipulation and is a leader in analytics. It was developed by the SAS Institute in 1966 and has been further developed in the 1980s and 1990s. SAS is easily accessible, and manageable and can analyze data from any source. SAS introduced a large set of products in 2011 for customer intelligence and numerous SAS modules for web, social media and marketing analytics. Today, these are widely used for profiling customers and prospects. It can also predict their behaviours, manage, and optimize communications.
5. Apache Spark 

The University of California, Berkeley’s AMP Lab, developed Apache in 2009. Apache Spark is a fast large-scale data processing engine and executes applications in Hadoop clusters 100 times faster in memory and 10 times faster on disk. Spark is built on data science and its concept makes data science effortless. Spark is also popular for data pipelines and machine learning models development. Spark also includes a library – MLlib, that provides a progressive set of machine algorithms for repetitive data science techniques like Classification, Regression, Collaborative Filtering, Clustering, etc.
To know about Proschool’s PG Data Analytics Course
6. Excel

 Excel is a basic, popular and widely used analytical tool in almost all industries. Whether you are an expert in Sas, R or Tableau, you will still need to use Excel. Excel becomes important when there is a requirement for analytics on the client’s internal data. It analyzes the complex task that summarizes the data with a preview of pivot tables that helps in filtering the data as per client requirements. Excel has the advanced business analytics option which helps in modelling capabilities. It has prebuilt options like automatic relationship detection, the creation of DAX measures and time grouping. Are you really a good data scientist if you don’t have these 6 vital data science skills? Click on the link to find out.
7. RapidMiner:

 RapidMiner is a powerful integrated data science platform. It is developed by the same company that performs predictive analysis and other advanced analytics like data mining, text analytics, machine learning and visual analytics without any programming. RapidMiner can incorporate any data source type, including Access, Excel, Microsoft SQL, Tera data, Oracle, Sybase, IBM DB2, Ingres, MySQL, IBM SPSS, Dbase etc. The tool is very powerful that can generate analytics based on real-life data transformation settings, i.e. you can control the formats and data sets for predictive analysis.
8. KNIME
 KNIME was Developed in January 2004 by a team of software engineers at the University of Konstanz. KNIME is a leading open-source, reporting, and integrated analytics tool that allows you to analyze and model the data through visual programming. It integrates various components for data mining and machine learning via its modular data pipelining concept.
9. QlikView

 QlikView has many unique features like patented technology and in-memory data processing. This executes the result very fast to the end-users and stores the data in the report itself. Data association in QlikView is automatically maintained and can be compressed to almost 10% of its original size. Data relationship is visualized using colours where a specific colour is given to related data and another colour to non-related data.
10. Splunk: 
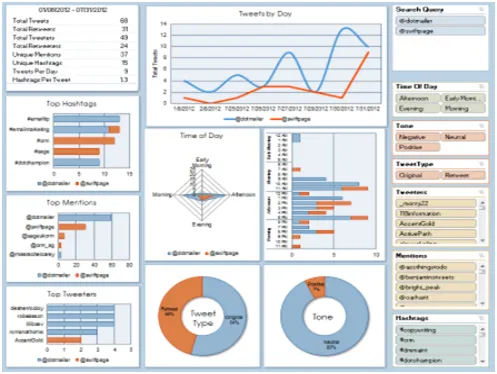
 Splunk is a tool that analyzes and searches machine-generated data. Splunk pulls text-based log data and provides a simple way to search through it. A user can pull in all kinds of data, perform all sorts of statistical analyses on it, and present it in different formats.
A budding data scientist? Here are the Top 10 companies that are great to start your career off with. All in all these tools can supercharge anything data-related that you can think of. Out of all the worthy ones, we hope you find your perfect weapon. If Data Science really feels like the best career choice for you, take expert guidance from Proschool Data Science Experts or Download Brochure to start off on the right track.


Spot on with this write-up, I really believe this site needs far more attention. I’ll probably be returning to read more, thanks for the info.
I needed to thank you for this excellent read!! I certainly loved every little bit of it. I’ve got you book-marked to check out new things you post…
There is certainly a great deal to find out about this topic. I like all of the points you have made.
The article has a beneficiary content, which has helped me a lot in understanding ……… It is a very informative blog which everyone should read to know.